GUIDE - Map opportunities and solutions, to drive outcomes (How to use an OST)
Product companies that operate using the product model organize into problem solving teams (product teams) in order to consistently “Solve problems to drive results”.
A team making this transition to become a problem solving team is going to need coaching and support. They will also need some tools and techniques to help them learn how to go from problem to solution by themselves.
Because starting without a specification of what to build is a fundamentally different way to build products.
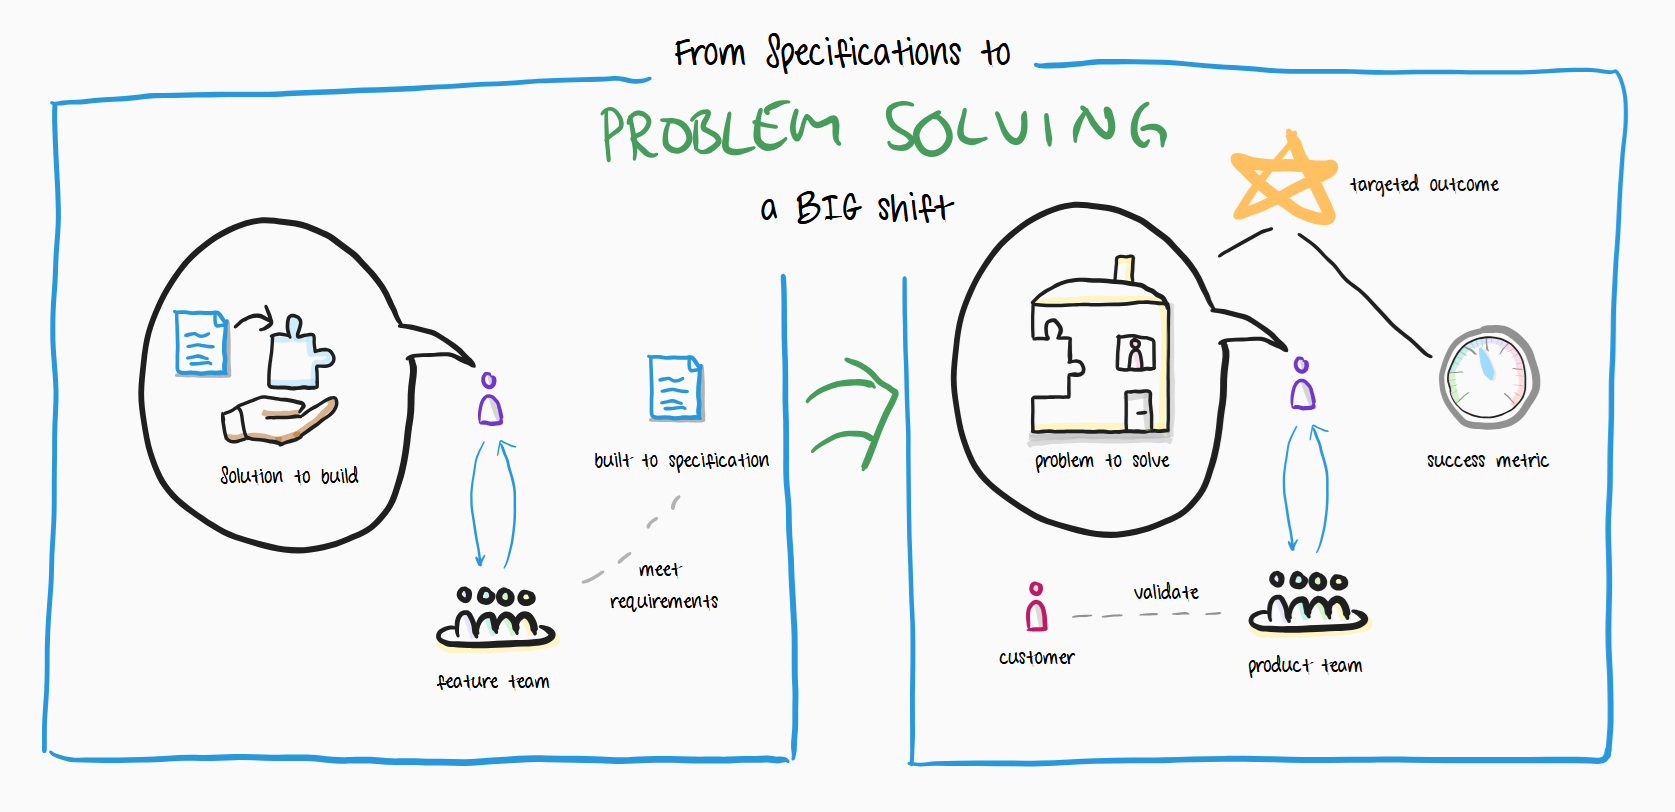
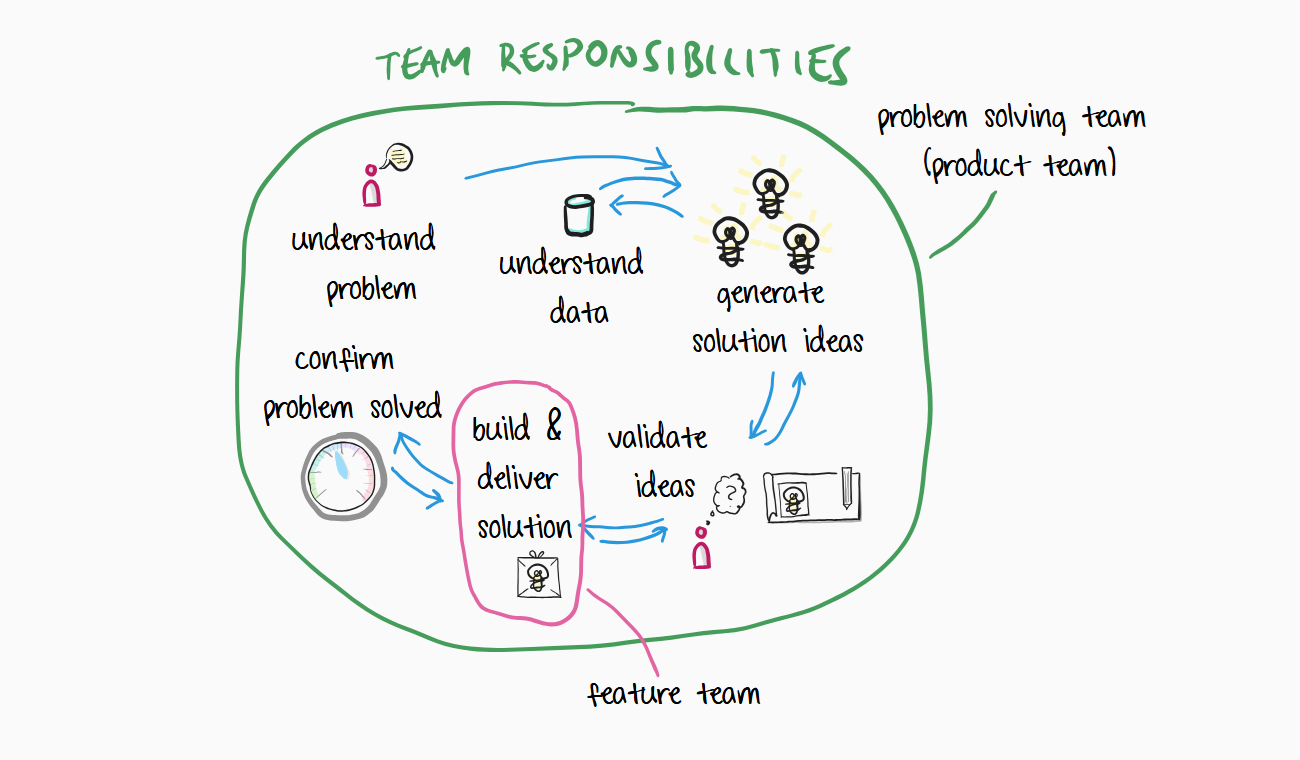
Therefore your teams will require different types of work to be performed at the team level. On a feature team the work is focused on building and implementing a solution that has been selected in order to put that solution in production. When solving a problem, that is only one of multiple different types of activities you need your team to be able to perform skillfully to become a problem solving team.
Using an Opportunity Solution Tree (OST) to solve problems
One tool that I have seen multiple times to be very helpful for teams that have made this transition is the Opportunity Solution Tree (OST), pioneered by Teresa Torres. However, I have also seen this tool frequently misunderstood and applied incorrectly - sometimes very incorrectly.
This despite the fact that at its core, this is a really natural and simple tool when you "get" how it works.
What is it for - we create an OST to
- solve customer problems without solution specifications
- make our hypothesis and assumptions visible
- enable collaboration around product decisions
- decide where to focus our product discovery efforts
- drive down real product risk, to increase probability of product success
In this article I will explain how to understand and use this simple tool in the correct way. The way I explain it here is how I have introduced it to multiple real teams who have successfully made this transition.
The starting point for our team
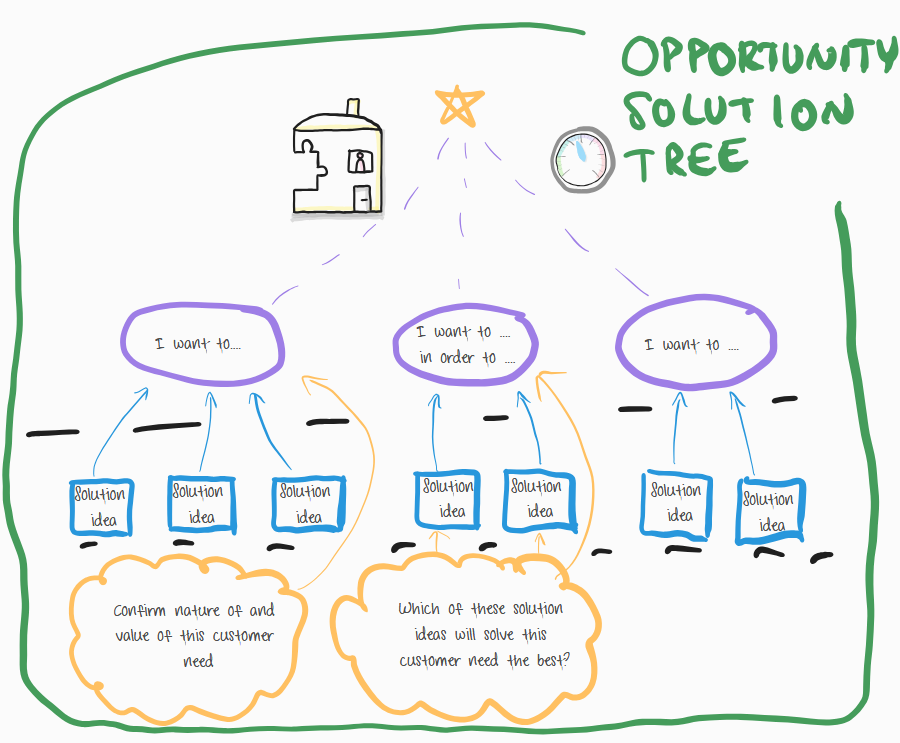
At the top of our OST we diagram our problem to solve and our success metric.
This is our targeted outcome, which typically represents a form of customer value or business value. The team typically receives this work as an OKR shared by product leaders together with a deeper strategic context. Product leaders explain their reasoning, share data that supports key insights, and offer additional information to help explain why this problem is important and valuable for us to focus on right now.
To get a good start in solving this targeted outcome, both team and product leaders need to avoid over-focusing on their OKR description and make sure they have enough depth of context for your problem - see this article for how to avoid this potential trap: "Thinking of your OKRs as newspaper articles".
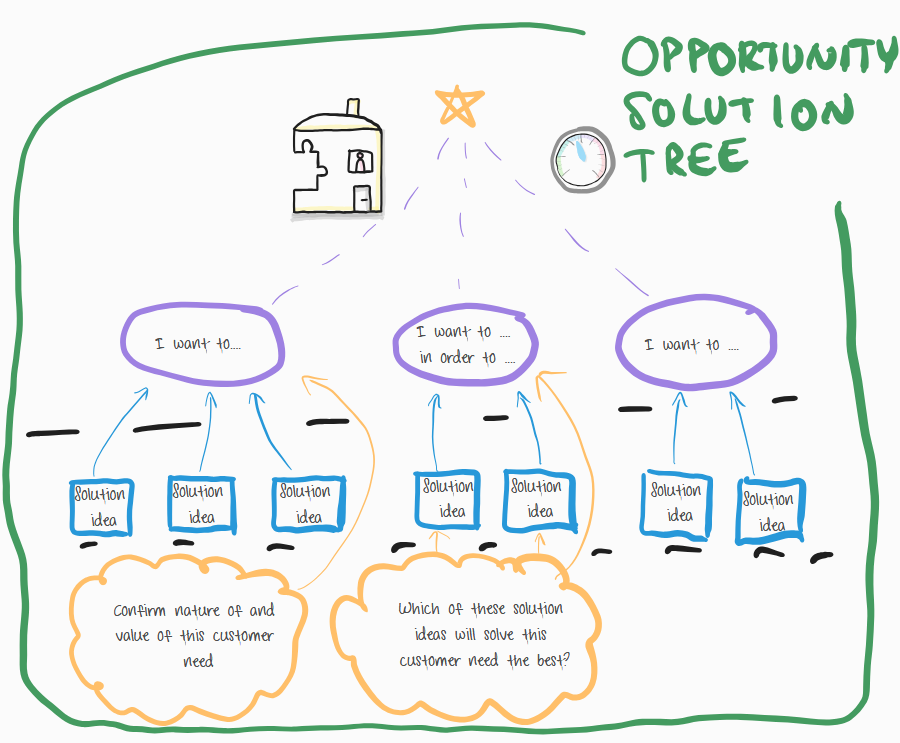
The anatomy of an Opportunity Solution Tree
We are going to build our OST step by step, directly from our team starting point - our team objective.

As we can see, at the very top is your problem solving team (product team). The team has been given work as a problem to solve (objective) and a success metric (key result), a measurable metric that indicates progress in solving the problem. This OKR is what is indicated as the star - a targeted desired outcome described as a problem to solve and a success metric.
Our problem solving team is “done” not when they have a solution in production, but when their success metric has moved. Meaning, this metric is what we will use as our goal posts - our evidence - of us having found a good solution that fits.
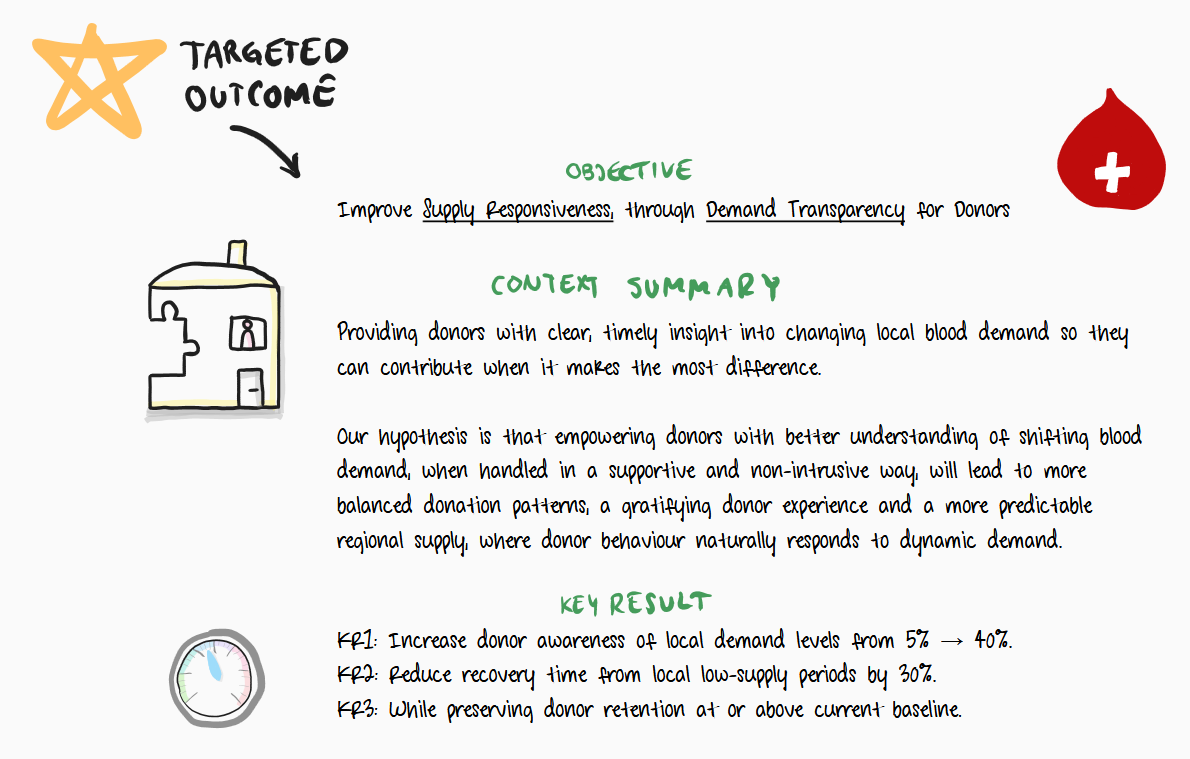
Example targeted outcome - imagine you are a team working for a regional blood donation organization, and you are supporting its operation with a blood donor portal. Donors use the portal to schedule donation sessions to donate blood. Below is a description of your team’s targeted outcome, in the form of a Team Objective and KRs.
1 - The first layer of the OST, customer needs (Opportunities)
As a team we may already have some ideas for what our solutions might be, and that is ok. The first layer of the OST is however focused on the customer, or user.
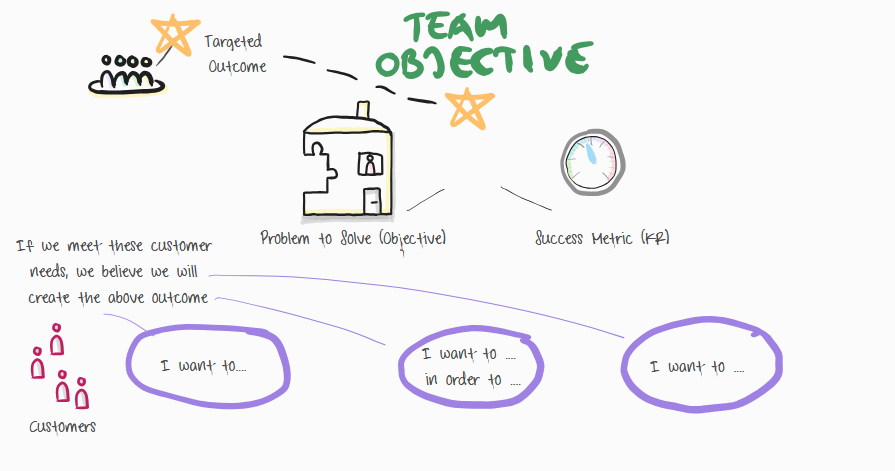
What needs do we believe that our customers or users have, that if our product would meet those needs, our problem would be solved, and our metrics would move? Imagine our product fitting perfectly to those customer needs in purple, then our customer would change their behavior and our objective would be completed.
For example - we might believe that donors want to know when to donate blood at a timing when it has the most impact, and if they know when that is at least some of them might schedule their donations when demand is higher. We also believe that this effect might be big enough to drive supply faster when demand naturally surges. But for this to happen a couple of basic donor needs will have to be met. For example, a donor will need basic cues that allow them to understand when blood demand for their blood group is lower or higher. Donors also want to feel gratified and helpful when receiving these cues in a supportive way, and specifically avoid feeling pressured or guilty if they can’t respond to demand.
We can phrase each of these as a customer need (donor need) relevant to our objective. That means that as a hypothesis we believe that if we offer basic cues to donors to help them understand current local demand levels then we will see both increased demand awareness and changed donor behavior to schedule donations to meet demand, which will drive the outcome we desire and are targeting.
We add this to our first layer of the OST as a statement about what we believe the customer needs, and phrased in the voice of the customer (I want/need...). In this example, something like this:
- “I want cues to understand local blood demand, so that I can schedule my donations when they have the most impact.”
- “I need to feel gratified and helpful when I learn more about demand levels (and avoid feeling pressured, lacking or guilty when I can’t respond to that demand personally).”
We add statements like this for any customer needs we believe are important to address in order to drive our success metrics. Each of these statements may not on their own be enough to drive our metric, but together we believe they could.
A key observation is that in a delivery or feature team setup, this whole layer - mapping assumptions about what the customer needs that our product should respond to and solve - in order for us to (later) deliberately challenge those assumptions - is typically completely missing at the team level. There is simply no or very little focus on understanding the customer needs that drive product decisions regarding what to put into the product. For obvious reasons. In a feature team setup we are simply not expecting our teams to learn anything about this, as we only expect them to deliver the feature (solution) we tell them to build.
This changes now, and it is a big change.
2 - The second layer of the OST, solutions (Product)
The second layer has a different focus. What does our product need to do to respond to those customer needs we just mapped out as relevant?
This is what we map out in the second layer of the OST, seen below the dotted black line in blue in the next diagram.
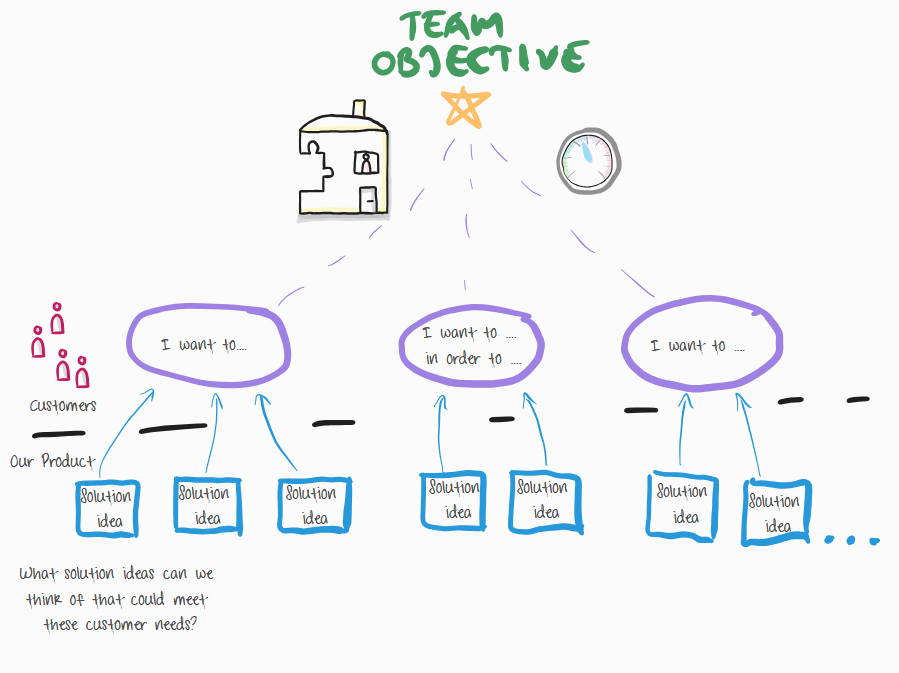
As we can see, the second layer is about our product - imagining what solution ideas we have that could directly meet the customer needs (purple) mapped in the first layer.
Continuing the example of blood donation, one of our ideas might be to show a weekly “demand level” indicator in our blood donation app. Another idea might be to offer personalized donation timing suggestions, that are tuned to eligibility and local demand. Or our team might explore a lightweight notification that highlights when your region enters a low-supply period.
At this point, none of these ideas represents a commitment to be built. They are potential solution ideas to be evaluated. We add these to our diagram.
Note that in the diagram we have more than one solution idea per customer need. This is another significant difference between a delivery or feature team and a problem solving team. In a feature team setup model we have typically already decided upon what feature we want our team(s) to build - a single solution idea. So there is next to no room left for creating and validating any different or innovating solution ideas. There is only room for implementation choices, not real solution choices.
Creating multiple solution options, and testing which one of those ideas actually responds the best to our customer needs, is one of the most important drivers for organizing in problem solving teams (product teams). This is what creates the space for empowered engineers and innovative solutions - another big deal.
Just by looking at your team’s OST this difference can be seen clearly. If every customer need (purple) only has one single solution idea box (blue), because our team has tunnel visioned on a single solution too early, every time - then that is easily visible in this diagram. If your team has multiple solution ideas for at least a few of the customer needs, then that shows room for solution ideation and innovation potential.
So let’s zoom out and summarize so far. We have started with our problem to solve at the top with a success metric that our team can use to measure progress towards solving the problem. We have mapped the customer needs we believe are most relevant to drive that metric and we have come up with several solution ideas to at least some of those customer needs.
3 - The third layer of the OST - Experiments driven by assessment of product risk
The next and last step of completing the diagram is to take a step back and look at this whole thing we have created so far and then ask a few critical thinking type questions.
- Where in this diagram do we have our most significant "product risk"?
- Where do we have the most uncertainty or need for more knowledge?
- Where do we have the least evidence to back up our product ideas?
- Where do we have the most to gain from learning more, to confirm what we believe?
- What data that we don’t have today would improve our confidence the most?
Your answers to these types of questions indicate where your team needs to focus your product discovery work, in the form of research, prototyping, validation, metrics and other forms of experiments.
Coaching points for deciding how to focus our discovery work
A few important coaching points when answering these types of questions.
- We do product discovery not to gain 100 % confidence based on bullet proof evidence. We are gradually working from lower to higher degrees of confidence levels.
- We do product discovery to improve our odds of being right, by identifying where stronger evidence (from outside the building) would be most needed because that is where our product risk is the greatest. Product risk is of course the risk that we build the wrong thing, and thus risk "successfully achieving product failure".
- Important - we do NOT use product discovery to research things that we already have a lot of evidence for, and have a well founded high degree of confidence for - or where it won’t matter much at all if we are wrong. That would be a complete waste of time and resources. This is a common misconception.
- What we do instead is use our best judgement and critical thinking, to assess where we can get the most “bang for our buck”, from doing product discovery. For the parts where our product choices matter the most, make sure we have enough evidence and go forward from there.
Therefore, your OST’s third level is there to support you in making the right decisions on where to focus your product discovery work.
Mapping experiments into your OST
With those coaching points in mind, let’s get back to the OST diagram armed with the right mindset.
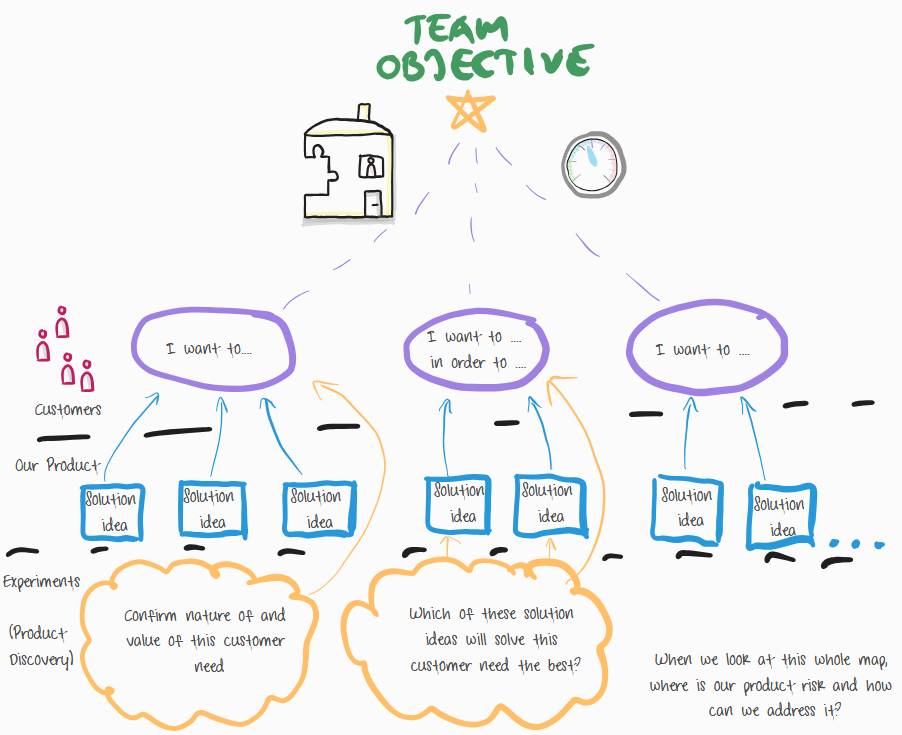
The third layer (yellow) is where we phrase our answers to the above questions as experiments and research questions.
Customer needs as drivers for experiments
For example, how certain are we that these purple customer needs exist? And not just exist, that they actually are important and indeed connect strongly to the problem we want to solve. So that if we address these needs we will actually drive the outcomes we are targeting?
- A coaching point I often use when I coach teams and directors is that we want to solve the customer problems that are “on the top 10-list” in terms of value, from the customer’s point of view. In the context of our OST, that means the customer needs that are most powerful in driving our success metrics.
Which ones are these, and how do we know?
Confirming the nature and value of a customer need in our example - maybe we are not sure what actually drives donor scheduling decisions, and if giving them demand cues will actually make a difference. Perhaps we are not sure how common it is that a donor feels guilty if they can’t help, or if this is a common reason for blood donor churn. If we knew more about donor scheduling drivers and reasons for donor churn, perhaps we could better express what their needs are before considering solutions to fit scheduling better to dynamic demand. To address this, let’s talk to 10 active blood donors, to see if we can confirm these donor needs. Ask them about how they schedule their donations and what makes them feel good about donating, so we can better understand their donation experience.
This allows us to better understand what it is like to walk in the customer’s shoes, in relevance to the problem we are focusing on and trying to learn about. After talking to these 10 customers (donors) we look for patterns, create a synthesis or summary of insights and discuss possible next steps.
Prototyping and evaluating solution ideas in our example - Another scenario might be that we are really confident about one of our customer needs, and that we definitely know we need to nail it down with a solution in order to solve our problem and move our metrics. Well in this case it is not so much about the upper part (purple) of our OST, but more about what solution idea (blue) will actually fit.
Now our uncertainty is about the problem-solution fit. Which one of these solution ideas will address this customer need the best and do the trick? Maybe we need to try out multiple solution ideas to confirm which one the user prefers or that somehow performs better?
So let’s have a solution ideation session and work on a couple of prototypes, for what we see as the most promising solution ideas. Then let's test these prototypes on real users, and then refine and pilot the really good prototypes to see if real customer behavior (product usage) confirms what we have learned in user testing.
Using your OST to decide where to focus your short term efforts
The questions above will naturally lead you into making a decision on where to focus your product discovery efforts.
The result of that decision becomes your tactical team focus for discovery the next week or two. And if we make that visible in the OST diagram, it might look like this.
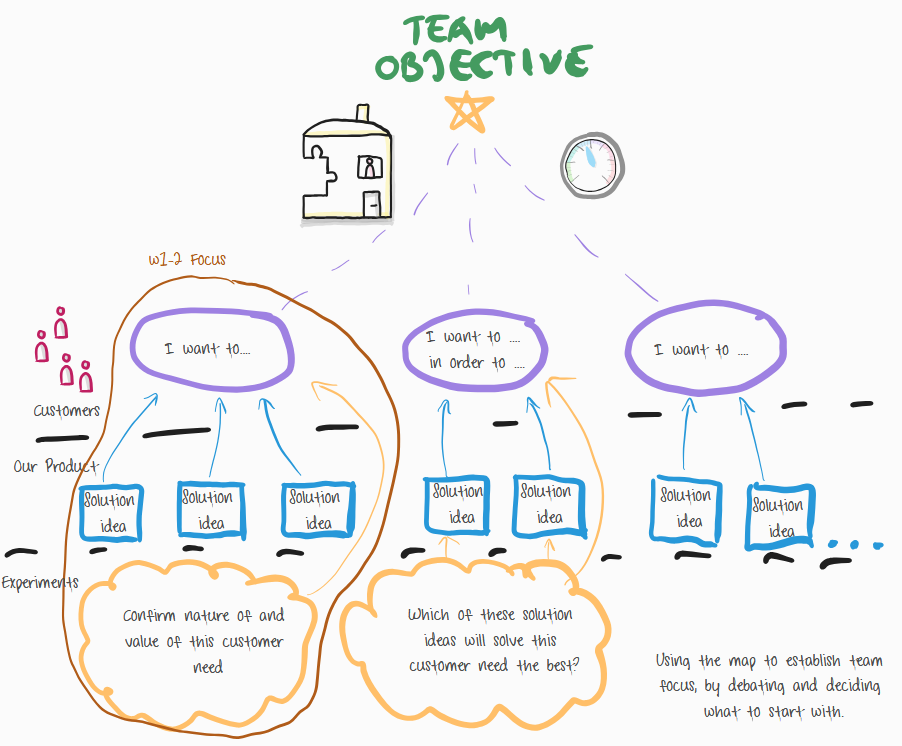
In the above diagram, the result of that decision (brown sub-tree) is your first discovery slice. In this case, focus on confirming the nature of and value of the left most purple customer need - for example by a series of generative customer interviews.
Summarizing so far - a complete Opportunity Solution Tree
Our diagram now has three full layers, all starting from our problem to solve and success metric(s) at the top.
This whole thing is what we call our Opportunity Solution Tree. To reiterate again, this is a tool we use to
- solve customer problems without solution specifications
- make our hypothesis and assumptions visible
- enable collaboration around product decisions
- know where to focus our discovery efforts
- drive down real product risk, to increase probability of product success
How to use an OST as a Tech Lead - Identifying feasibility experiments
But what if I am a tech lead, how do I use this OST diagram then? You might feel that this diagram is very much created outside-in and mostly focuses on how the product meets the user but less so about what it might take to build those solutions - and you would be right.
Well, it is still about assessing where there is the most uncertainty - specifically around technical feasibility.
To make your assessment as a tech lead, take a look at the whole OST - not just one branch in isolation.
For the things that look likely that we are going to need solutions for - the blue boxes that we believe are probable - what is the difference between our current product architecture and solution design and what these boxes might need to look like technically if we build them?
- Will we need different architectural capabilities?
- Will we need new API service integrations?
- Will we need any new libraries or components?
- Will we need different infrastructure?
- Will we need better performance?
- Are there any new information models or data sources?
- Is there anything else we need to change in the architecture to enable these potential solutions?
- How would we make sure that any modified infrastructure or architecture will have a high degree of testability, and will be easy to add functionality to safely - possibly at scale over multiple teams?
- Will this require significant changes to our current deployment pipelines?
- Or if your product is physical, will this require frequent integration of new physical components or require new manufacturing capabilities?
Based on your answers, where is the technical uncertainty - your feasibility risk? Is there anything in this potential solution space we will need to create a technical experiment to validate?
For example, do we need to build a technical prototype or create a spike to answer a specific technical challenge? Do we need to create a specific throw away code branch where we very quickly make some significant changes to our code base, in order to evaluate what is technically possible? Do we need to learn about new technologies, put them together in a prototype and create a hello world level proof of concept that validates that combining those technologies will be a viable way to build?
For those answers where there is meaningful feasibility risk, create a technical experiment.
And if you ever find yourself wondering about what the “requirements” for all the above are - remember, there will be no magic specification to be handed down from somewhere else. Regarding how you solve the problem it will be up to you and your colleagues to decide what solution to build. And together it is up to you and your colleagues to understand the size and needs of the user and customer base you are targeting with those solutions, by staying in direct contact with customers.
This is what will drive your functional and non-functional technical constraints.
A full example Opportunity Solution Tree
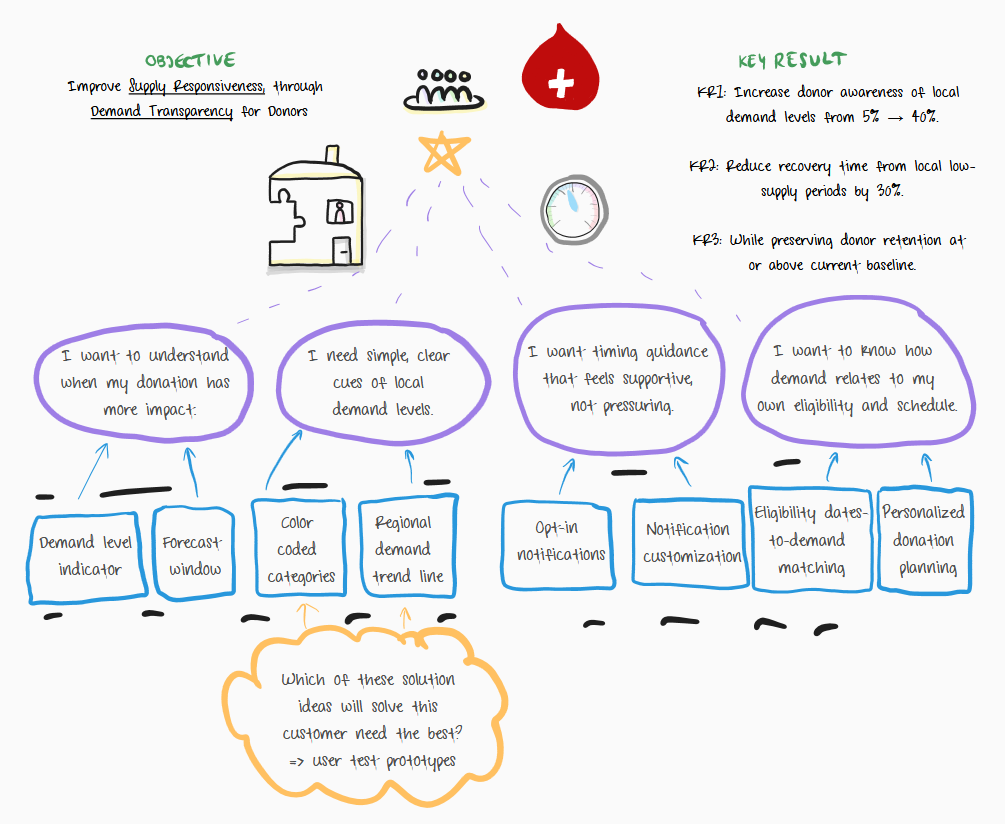
As we can see, our blood donor team decided to focus first on nailing the right solution for how to offer simple, clear visual cues of local demand levels. This meant creating multiple solution prototypes, testing these prototype ideas on real active blood donors to validate how well these fit and then pick the best combinations of solution ideas to build.
Wrapping up - what is your OST for?
So now we understand how to build our own OST. Great! But what do we use it for and how should we think of it and develop it over time as we progress?
When used correctly, an OST is a great way to align on what a team needs to focus on in order to drive down product risk. It will help you create a clear step by step path that will get you closer to a high confidence situation regarding what functionality to put into your product, in order to create product success.
It’s a shared snapshot - of what we know right now - we update it as we learn
Your OST is a snapshot of our best understanding in time. And a shared mental map of what we need to collaborate on. It offers a visual illustration of what to prioritize in what order, and as such can be a mini-roadmap for solving your customer problem.
The OST is mostly a throw away stepping stone collaboration artifact that helps us stay disciplined. We use it to solve the customer problems we focus on. After that we do not need the OST as much anymore.
As we learn, we update this diagram. And sometimes as we get our answers, we can remove whole parts that either are not relevant anymore, are completely confirmed or that we now know did not work out. Left are the pieces we are still considering or actively working on to explore.
Defining sharp metrics and KRs is a great way to offer strong focus for what part of the OST to work on in the near term.
Summary
Great products that elicit customer delight are not created randomly or through product magic. They are created deliberately to find out what will actually matter for the customer, and then persistently working to find a solution that not just will be ok but will be a great fit to that customer problem.
Using an opportunity solution tree the right way can help you and your teams do this consistently.
Ready to explore possibilities?
Dive into transformation! Connect with me to explore how you can elevate your business to new heights.
